2×2 Rubik’s Cube
Month: December 2020
Transmission Tower Details Dec 2020
I observed a few details of my neighborhood transmission tower.
Wondering about the History of Horseshoes Dec 2020
Best of Seven Outcome Probability Dec 2020
There must be 70 ways to … win the playoff.
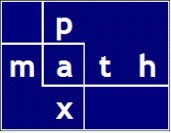
From Punch Cards to Flash Memory Dec 2020
D Day Paratroopers June 1944
QuickLinks
Instant Access to all Posts
Short Takes
My Dash apps
My GeoGebra app
What is the most general equation for the area of a triangle?
The Wait calculation
The incessant obsolescence postulate (IOP)
Barnard’s Star and the 'Wait Equation'
IOP counterargument
The amazing arbelos
Japanese temple geometry
★ Sister Celine — a beautiful life
★ John Lienhard IV on Ingenuity
★ Charles Stutzenbaker, Field Biologist
Neal Stephenson on the OS
A few quotations
Tyler TX weather • 🌡 Steve Fitzgerald
Tyler TX weather • 3-day history
Tyler TX weather • calendar month
Tyler TX weather • graph month
East Texas weather • TAMU
★ All of the water in the world
Hacker News (from YCombinator)

Instant Access to all Posts
Short Takes
My Dash apps
My GeoGebra app
What is the most general equation for the area of a triangle?
The Wait calculation
The incessant obsolescence postulate (IOP)
Barnard’s Star and the 'Wait Equation'
IOP counterargument
The amazing arbelos
Barnard’s Star and the 'Wait Equation'
IOP counterargument
Japanese temple geometry
★ Sister Celine — a beautiful life
★ John Lienhard IV on Ingenuity
★ Charles Stutzenbaker, Field Biologist
Neal Stephenson on the OS
A few quotations
Tyler TX weather • 🌡 Steve Fitzgerald
Tyler TX weather • 3-day history
Tyler TX weather • calendar month
Tyler TX weather • graph month
East Texas weather • TAMU
★ All of the water in the world
Hacker News (from YCombinator)


