Soil Texture Triangle with Plotly Jun 2023
Soil Texture Triangle with Plotly
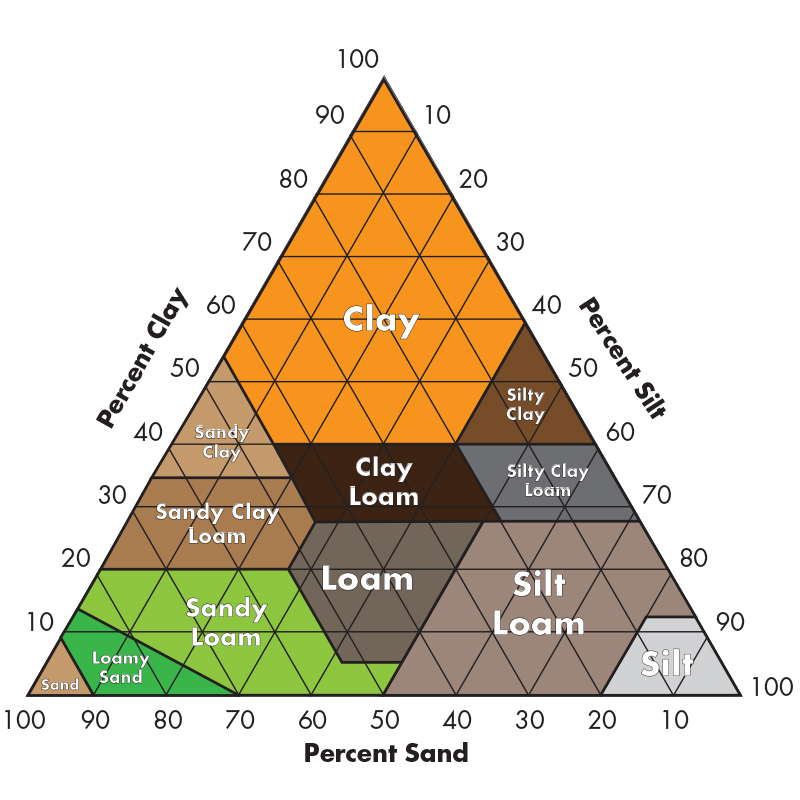
Soil is made up of the following three soil components:
Thank you to Dan Sunday and Jacob Rus for their posts regarding winding numbers.
- sand,
- clay,
- silt.
Soil texture is often presented using the ratios (or percentages) of the 3 soil components. The 3 ratios must add to 1.0 (or 100%).
I built a set of functions to allow the categorization and plotting of soils.
I built the general application using Plotly. First, I programmed in Python using Jupyter Lab, then I ported the categorization functions to PyXLL.
I learned a few things along the way:
- The soil texture triangle is a specific example of a ternary plot
- Ternary plots are built-in functions in Plotly
- Categorizing a soil is as easy as determining if a point is within a polygon. This can be done using a couple methods:
- Triangulate the category polygons using the input point as a hub in conjunction with all polygon vertices: if the sum of the triangle areas equals the polygon area, then the input point is within the polygon.
As an example, visualize an input point within the category ‘loam’. Make that input point into a hub and draw 5 lines out to the ‘loam’ polygon vertices. Sum the absolute value(area) for the 5 resulting triangles. Compare that sum to the area of the ‘loam’ polygon: if the two areas are equal then input point is within the polygon. - Determine the winding number for the input point: if the winding number is non-zero then the input point is within the polygon.
- Using the first approach, I wrote my own triangulation algorithm and it works.
- However, the second approach is faster and is more elegant.
Thank you to Dan Sunday and Jacob Rus for their posts regarding winding numbers.
Thank you to Cyrille Ka for his post regarding determining if a point C is on the line segment defined by A and B.
https://observablehq.com/@jrus/winding-number
Live Example Plot
Click for live plot
In my version of the soil texture triangle, I use RGB coloring to illustrate the sand, silt, clay content. I use the centroid of each polygon as a reference coordinate for the RGB color.
In my version of the soil texture triangle, I use RGB coloring to illustrate the sand, silt, clay content. I use the centroid of each polygon as a reference coordinate for the RGB color.
Code snippets as requested by Quoc Duong PHUNG
Code removed Aug 22 2023


Hi Sir,
I’m very impressed with this work.
I would greatly appreciate it if you could share the source code with me so that I can learn from it.
Thank you, sir.
In reply to Quoc Duong PHUNG.
Thank you for the comment. I would rather share only snippets of code. Are you an engineer? Which aspect interests you: Plotly, maybe ternary charts, or maybe geotechnical engineering?
Hi Sir,
Thank you for your answer.
I’m not an engineer; I’m an informatician. We have a project for data visualization in the agricultural domain (using Plotly in Python). By accident, I found your work through Google.
I am interested in ternary charts with Plotly.
Thank you, sir.
qdphung19@gmail.com
See my updated post; it would be interesting to see some of your data visualizations.
Thank you very much, sir.