It was, originally, a Windows 7 machine. Bought in 2010.
Yesterday, I wiped the disk and installed 2024 Linux Ubuntu 24.04.1 LTS.
It’s now a 500GB Linux machine with a DVD drive, SmartCard slot
~~~
It was, originally, a Windows 7 machine. Bought in 2010.
Yesterday, I wiped the disk and installed 2024 Linux Ubuntu 24.04.1 LTS.
It’s now a 500GB Linux machine with a DVD drive, SmartCard slot
~~~

I have built a few Plotly charts and have learned a few tricks along the way.
Reading the docs will get you part of the way there but trial and error is required to go all the way.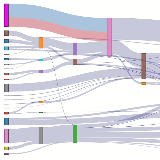

I built a set of functions demonstrating dynamic filtering and sorting using Excel and PyXLL. The functions determine whether a value is within a numeric interval (closed, open, or any combination).
A video illustrates the performance.

One million filters
I built a full PySide2 menu that allows the selection and presentation of AISC steel properties and the calculation of ASCE wind loads.