From the wiki https://en.wikipedia.org/wiki/Gaussian_function (go to wiki)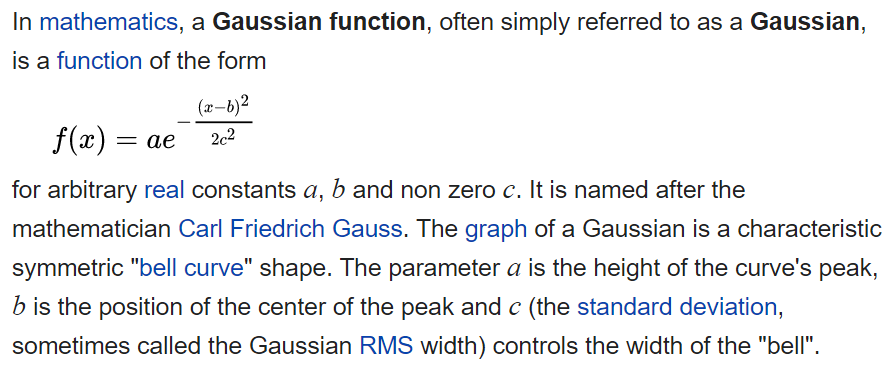
Gaussian profile
Try the sliders
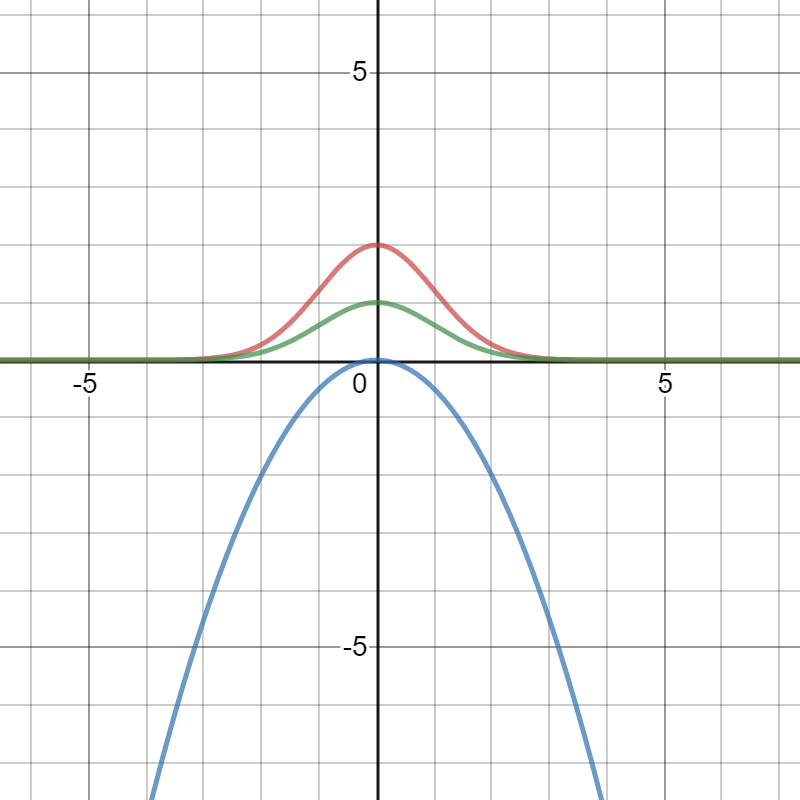
What do the parameters a, b, and c control?
Pretty obvious, pretty quick with the graph and sliders
Link to first example using live Desmos app
What do the parameters a, b, and c control?
Pretty obvious, pretty quick with the graph and sliders
Link to first example using live Desmos app
Another example
Simple equations
Link to second example using live Desmos app
Link to second example using live Desmos app


