
- Building uses vary (for example, residential to nuclear facility)
- Geotechnical considerations vary (rock, soil, stratigraphy, chemistry, strength, stability)
- Loadings vary
Wind, rain, flooding, temperature, snow, ice, frost depth, and seismic activity vary
- Political jurisdictions vary
- Building codes vary
- A design intended for the envelope of all the above would be most uneconomical
In this post, the most comprehensive reference is the American Society of Civil Engineers (ASCE). The American National Standards Institute (ANSI) published the first consensus standard for structural loads, ANSI A58.1, in 1972. The standard has been updated about every six years. The current version is ASCE/SEI 7-22.
ASCE 7 describes the means for determining design loads including dead, live, soil, flood, tsunami, snow, rain, atmospheric ice, seismic, and wind loads and their combinations for general structural design.
Reference
I have personal experience with flooding. I grew up in Groves, Texas (in Jefferson County) along the Gulf Coast. My parent’s house was pier and beam construction, built on a lot at 9.5′ above sea level (before subsidence). I grew up in flat country with ~50 inches of rain per year. It was not unusual at all to see the entire school playground inundated with inches of rainwater.
Generic Rain flooding
Before and during the big rains, my father volunteered (and I was drafted) to clean the culverts downstream of our house. The construction in our area was predominantly raised crowned asphalt roads flanked by bar ditches. Most of the city sits at an elevation of 3 to 14 feet above sea level. In south Jefferson County, rainwater collected by the large drainage canals is discharged with assistance from drainage pumps — the canals are pumped down in anticipation of rain with continued pumping as needed. The pump discharge goes to the Intracoastal Canal then to Sabine Lake then to the Gulf of Mexico.
Coastal flooding
During Hurricane Audrey, a serious rain event, water was say 2′ deep in our yard, barely lapping at the finish floor elevation when vehicles left a wake while going down the road. Despite this high water, there was little property damage from flooding (at our house). In our town, Hurricane Carla brought more storm surge flooding. Landfall occurred in Port O’Connor Aransas, 185 miles ESE of Groves. Though our family evacuated well in advance of the storm, while driving out, we saw the tide water rising in the shallow ditches along Highway 366. In our area, the maximum storm surge from Carla was about 7 feet. Notice that the maximum storm surge was 22 feet (!) near Port Lavaca.
References
National Hurricane Center Storm Surge Risk Maps [Excellent]
Above, I have described only two kinds of flooding, and both of those address a coastal plain. Far worse flooding is due to confined flow in or from a watershed. In river flooding, the water level rise could be due to excessive rain or snowmelt. Often there is great depth and high velocity due to variation in the terrain. Flash flooding is the rapid accumulation of flood depth. With this, I have no experience.
Compare coastal flooding to river flooding (fluvial):
In 2023, one can say all floods have a man-made component. In the coastal variety, hurricanes have been coming for centuries, and the development of towns and facilities increases the loss of life and property. Short of levee protection systems, there is not much man can do to stop or alter coastal flooding.
Rivers flood. An entirely natural river will flood and an altered river will flood. The tendency is to build along the river without leaving room for the extensive natural flood plains. The development of towns and facilities tends to hem in the river. Periodically there is loss of life and property as the river exceeds its banks.
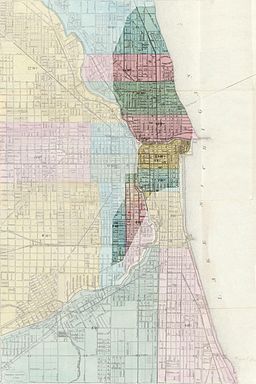
A dramatic example is the Mississippi River through New Orleans where you are walking at street level and you see a ship traveling the river, yet the river level and the ship are ten or more feet higher in elevation. Years back, New Orleans was at a higher elevation. Pumping of underground water caused subsidence. The river was lined with levees in an effort to control flooding. Silting of the river raised the river bed. Levees were built higher. And we reach the present state where New Orleans is at far greater risk primarily due to man.
Why would anybody build a city on ground that is below sea level?
New Orleans may be a spectacular example of the evolution of a river town but the situation is unfortunately similar almost everywhere.
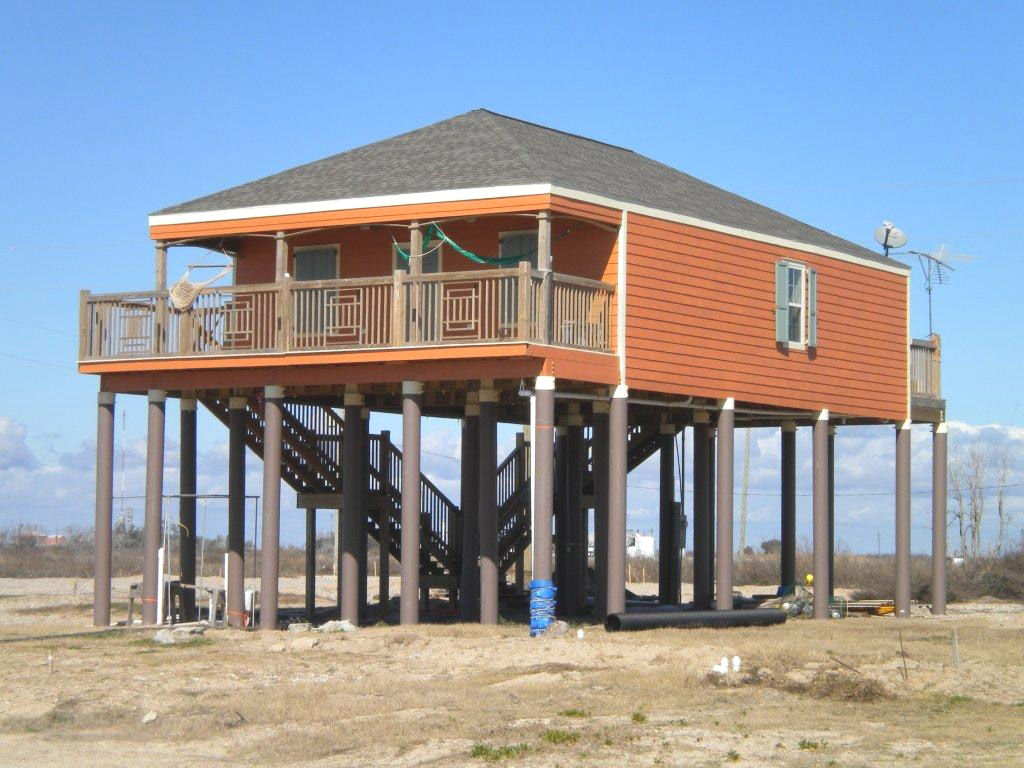
The common theme in most all development along rivers and coasts, is that flooding has been combatted by a rather dramatic alteration of the landscape rather than adaptation to the natural conditions. A clear and economical example of adaption is a beach house constructed on tall pilings.
Flooding is experienced well away from rivers and coasts, let’s call this generic rain flooding. Also let’s recall that hydrology is the branch of science concerned with the properties of the earth’s water, and especially its movement in relation to land. What have we learned from hydrology? The factors contributing to rain accumulation are:
- rainfall intensity
- rainfall duration
- topography
- soil conditions, and
- ground cover
The two rainfall factors are generally a function of nature. Though the other three factors might also be a function of nature, these are most likely altered by the activities of man. Terrain with large slope, low absorption, and less ground cover tend to cause more accumulation and runoff. In hydrology, there is a formula, called the Rational Equation, that illustrates the situation.
![\[Q={c}\cdot{i}\cdot{A}\]](https://www.mathpax.com/wp-content/ql-cache/quicklatex.com-91e0500fa93183924353fe844d5311ef_l3.png "Rendered by QuickLaTeX.com")
The Rational Equation requires the following units:
   Q = Peak discharge, cubic feet per second
   c = Runoff coefficient
   i = Rainfall intensity, inch/hour
   A = Drainage area, acre

Range of runoff coefficients
   Forests  0.05 - 0.25
   Roofs    0.75 - 0.95
   Streets  0.70 - 0.95
Another approach to quantifying runoff is given by the SCS TR-55 approach.
Urban Hydrology
for Small Watersheds TR-55
Reference
SitingAs in the document below, the existing grades and proposed grades must be accounted for in controlling rainfall runoff.
In my opinion, siting is both art and science, neither of which is applied much in modern building. It is obvious to me that cities historically developed on the best land, relatively high ground albeit with near access to water. Water was needed for consumption and for shipping. As populations have grown and cities expanded, necessarily, lower quality land is used. This lower quality land might flood more easily, might be on poor soil subject to excesive settlement, etc.
Look at the sites under construction in your town. These sites were left undeveloped, rejected, for decades. Now these lower quality sites are being used. Extra care in engineering and siting might be expected: removal of incompetent soil, use of select fill, properly compacting the fill, engineered retaining walls, raising the yard elevation, raising the finish floor elevation, giving attention to site slopes especially near the foundation and paving, giving attention to disturbed soil (plumbing, sprinkler, electrical, cable trenches). Unfortunately, I see ever more expensive houses built on ever less fit sites.
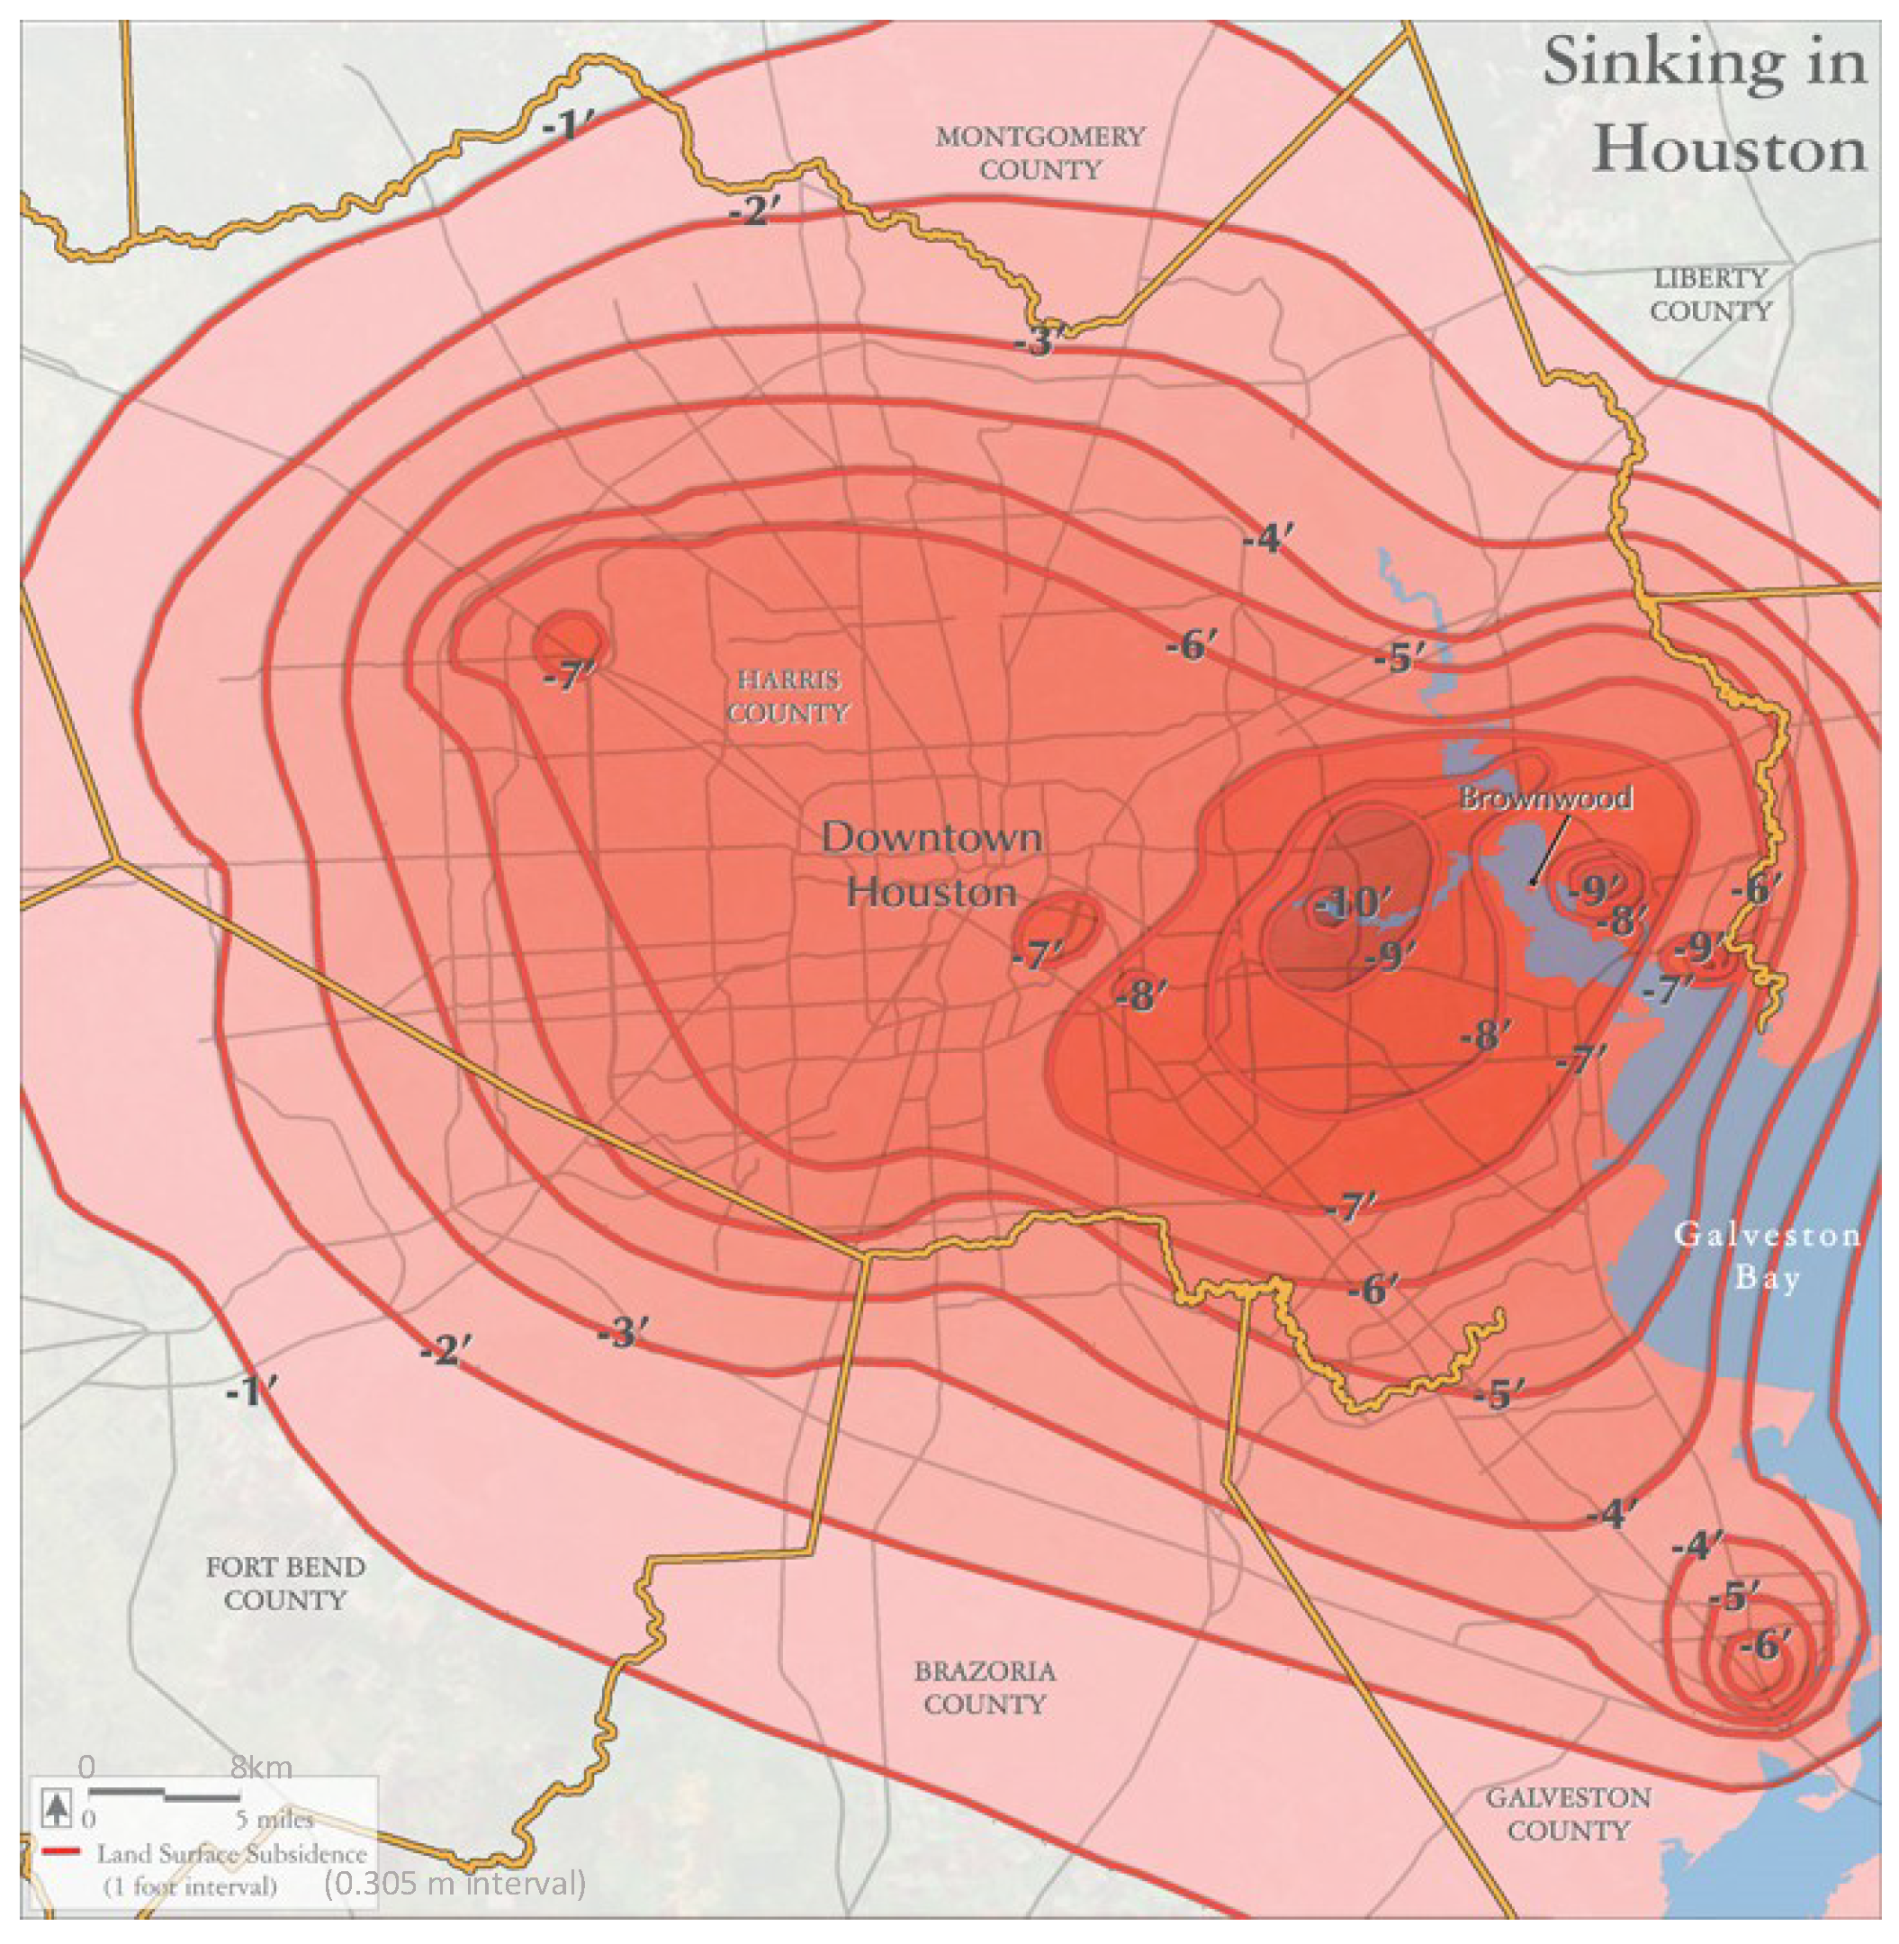
Subsidence, downward vertical movement of the Earth’s surface, is a passive contributor to flooding.
References
![\[F = \frac{1}{2}\cdot{\rho}\cdot{V}^2\cdot{A}\]](https://www.mathpax.com/wp-content/ql-cache/quicklatex.com-2cdae0b85330095a2cba858205fd8d34_l3.png "Rendered by QuickLaTeX.com")
The general wind force equation parameters:
   F   = Force exerted on a surface, pounds
   rho = Density of the atmosphere at sea level, pounds per cubic foot
         0.0765 pounds per cubic foot is used in design equations;
         this is the standard atmosphere with a barometric pressure
         of ~1013 mbar at a temperature of ~59 F
   V   = Velocity of the wind, miles per hour
   A   = Surface area, square feet

   The wind force varies as the square of the wind velocity.
      The wind pressure doubles for each of these velocities: 12.5, 25, 35, 50, 71, 100, 141, 200 mph.
      Therefore the force at 100 mph is 64 times that at 12.5 mph.
      A 140 mph hurricane creates twice the wind force of a 100 mph hurricane.
![\[Qz = {0.00256}\cdot{K_z}\cdot{K_{zt}}\cdot{K_d}\cdot{V}^2\cdot{G}\cdot{C_f}\cdot{A}\]](https://www.mathpax.com/wp-content/ql-cache/quicklatex.com-fd99995a7da0b09196fbf0c731a02fd9_l3.png "Rendered by QuickLaTeX.com")
The on-the-structure wind force equation parameters:

   Kz  = Height modifier, nondimensional
         lowest at grade level, increases with height

         Kz is a function of the exposure category:
            B is for urban and suburban areas
            C is for open terrain with scattered obstructions
            D is for flat, unobstructed areas and water surfaces

         Exposure B implies less wind force,
         Exposure D implies greater wind force
   Kzt = Upwind topographic speed-up factor, nondimensional
   Kd  = Directionality factor is a load reduction factor intended to take into
         account the less than 100% probability that the design event wind
         direction aligns with the worst case building aerodynamics, nondimensional
   G   = Gust response factor, nondimensional
   Cf  = Net force coefficient (aka drag coefficient), nondimensional
            say 2.0 for a blunt (square shape) object such as a column
            Cf is determined and applied to each part of a structure
            Cf for a monoslope free roof might vary from
               negative 2.5 (uplift pressure) to
               say positive 2.7
            Cf for a rough cylindrical tank or chimney
               say 0.7 to 0.9
Example
Here is an example to illustrate the quantitative effect of wind.
Take a freestanding solid wall (or fence). The wall is taken as 5′ high and 50′ long.
I calculate the design force and pressure on the wall for various exposures and wind velocities.


Notice:
- the great loading variation with exposure and velocity.
- the wind force for 100 mph is double that for 70 mph.
- open terrain Exposure C values are ~150% that of urban Exposure B.
- unobstructed terrain Exposure D values are ~180% that of urban Exposure B.
I have no personal experience with earthquakes; I’ve never been in a seismic event.
However, as a structural engineer, I have designed facilities in seismic-prone locations.
Designing for seismic load is unlike designing for dead load, live load, and wind load. With dead, live, and wind load, we expect the structure:
- to remain linearly elastic (no permanent deformation)
- to remain operable under load and thereafter
- to sustain no damage.
- Note that the loadings include forces and moments
With seismic, we expect the structure to perform as above in the OBE (operating basis earthquake) but for the MDE (maximum design earthquake) we expect the structure:
- to perform without loss of life or catastrophic failure
- to remain stable and operable such that all occupants may escape the building
- to tolerate possibly severe damage or economic loss
- Note that the loadings are not forces and moments; rather, ground motions
Seismic design is based on parameters such as building occupancy, mapped (ground) acceleration parameters, and site classification.
   Building occupancy
      Category I    Structures that represent low hazard to human life
      Category II   Structures not falling into Category I, III or IV
      Category III  Structures that represent substantial hazard to human life
      Category IV   Structures designated as essential facilities

   Site classification
      Determined by the specific soil properties found at the site
      Usually provided by the geotechnical engineer for the project

      Site Class A  Site has hard rock
      Site Class B  Site has rock
      Site Class C  Site has very dense soil and/or soft rock
      Site Class D  Permitted to be assumed in absence of a soils report
                    unless the local authority determines
                    Site Class E or F materials
      Site Class F  Site that has soils that exhibit high liquefaction tendencies.

   Acceleration parameters
      As suggested, qualitatively, in Figure 1 and Figure 6 of 'Seismic Building Code Provisions for New Buildings to Create Safer Communities'
Some locations never see snowfall. Some locations have design snow loads of more than 100 psf (Anchorage, 50 psf; Juneau, 60 psf; Whittier, 300 psf !!). Even in the continental USA, the design snow load might be upwards of 50 to 90 psf. Compare these with the typical 20 psf live loading for flat or pitched roofs.
Ice loading
The design thickness of atmospheric icing varies from zero in south Florida to 2.5 inches in northern New York. For a surprisingly large extent of the USA, the design ice thickness is 1 inch.

- In 1631, Boston’s governor John Winthrop outlawed wooden chimneys and thatched roofs
- In the UK, the Great Fire of London in 1666 set in motion changes that laid the foundations for organized firefighting in the future
- The first New York fire brigade entered service in 1731 equipped with two hand-drawn pumpers that had been transported from London, England. These two pumpers formed Engine Company 1 and Engine Company 2. These were the first fire engines to be used in the American colonies, and all able-bodied citizens were required to respond to a fire alarm and to participate in the extinguishing under the supervision of the Aldermen.
- In 1736, Benjamin Franklin established the Union Fire Company in Philadelphia
- The New York City’s first firehouse was built in 1736 in front of City Hall on Broad Street. A year later, the colony’s General Assembly created the Volunteer Fire Department of the City of New York, appointing 30 men who would remain on call in exchange for exemption from jury and militia duty. The city’s first official firemen were required to be “able, discreet, and sober men who shall be known as Firemen of the City of New York, to be ready for service by night and by day and be diligent, industrious and vigilant.”
- Although the 1737 Act created the basis of the fire department, the actual legal entity was incorporated in the State of New York in 1798 under the name of “Fire Department, City of New York.”
- In 1845, the last great fire to affect Manhattan began early in the morning and was subdued that afternoon. The fire killed four firefighters, 26 civilians, and destroyed 345 buildings
- The Cincinnati Fire Department became the first full-time paid career fire department in the United States, and the first in the world to use steam fire engines in 1853
- The United States did not have government-run fire departments until around the time of the American Civil War
- The Great Chicago Fire destroyed 3.3 square miles of the city in October 1871. City officials never determined the cause of the blaze, but the rapid spread of the fire due to a long drought in that year’s summer, strong winds from the southwest, and the rapid destruction of the water pumping system, explain the extensive damage of the mainly wooden city structures.
- The Great Baltimore Fire occurred in February 1904

Excerpt — National Fire Protection Association
In 1895, a Committee on Automatic Sprinkler Protection was formed in Massachusetts by men affiliated with several fire insurance companies and a pipe manufacturer to develop a uniform standard for the design and installation of fire sprinkler systems. At the time, there were nine such standards in effect within 100 miles (160 km) of Boston, Massachusetts, and such diversity was causing great difficulties for plumbers working in the New England region.
The next year, the committee published its initial report on a uniform standard, and went on to form the NFPA in late 1896. The committee’s initial report evolved into NFPA 13, Standard for the Installation of Sprinkler Systems, the most widely used fire sprinkler standard.[6]
Around 1904, the NFPA began to expand its membership from affiliates of fire insurance companies to many other organizations and individuals and also expanded its mission beyond promulgating fire sprinkler standards.
National Fire Protection Association
In building and facility design, there is great emphasis on design for fire resistance and design of fire protection.
Despite the emphasis, design for wildfire has not been addressed as much by building codes.
The Wildland Urban interface (WUI) code is a model standard for wildfire design. Colorado is leading in this area of design. A wildland-urban interface (WUI) code is specifically designed to mitigate the risks from wildfire to life and property. The standards within a WUI code will vary according to the scope that a community is willing to adopt and enforce.
I provide a few online references:
- Design for Fire Resistance discussion
- Updates from the ASCE/SEI Fire Protection Committee
- Preparing homes for wildfire
Home Ignition Zones
Tree Spacing


A few wildfire references


