But this time — in December 2022 — I demonstrate PySimpleGUI, a high-quality graphical interface.
Notes
- Sliders are easily customized
- integer, decimal (with decimal places)
- style, color, width, tick spacing, tick labeling
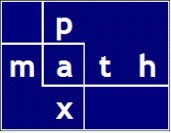
- Custom graphic images are easily built. In this example,
- I built a second dialog with a diagram of the user input
- Labeled the image with the user input parameters
- Saved the image as a PNG file for printing/copying
Conclusion
PySimpleGUI is my new go-to dialog approach.
There are several great plotting apps, Plotly for one; however, the plotting routines are not generic enough to build an image on an arbitrary coordinate system.
PySimpleGUI allows any arbitrary (linear) coordinate system with user defined positive directions: up, down, left, right.
Then, with a few primitives: rectangle, ellipse, line, text, et cetera, we can draw just about any diagram. This is ideal for engineering apps.
Professional results that are much easier and more flexible than those using PyQT or PySide.
What is PyXLL-Jupyter?
Integration for Jupyter notebooks and Microsoft Excel.
Second video is a bit longer. Starting in Excel using PyXLL, then invoking the Jupyter custom task pane (CTP), then illustrating PySimpleGUI running inside Jupyter.


.svg)
